
Tracking what’s happening in a campaign is useful for seeing what’s working well and if anything needs changing.
Proca collects all of the data from supporters interacting with the widget: not only actions taken and contact opt-ins, but which widget a supporter engaged with, whether they shared it, whether their share resulted in actions.
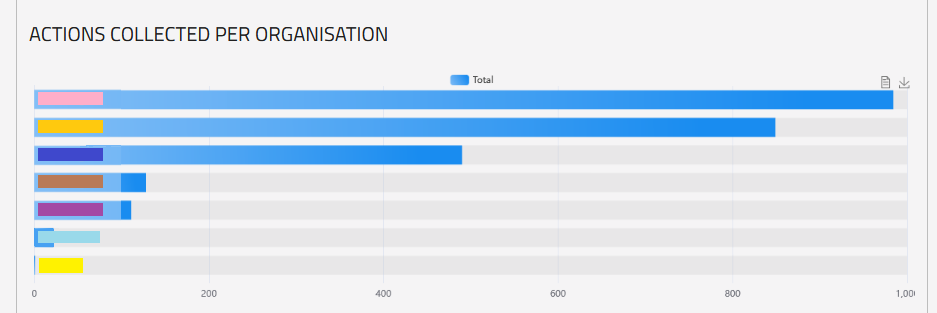
Basic Counter
On our dashboard, each campaign has a simple bar chart showing how many actions have been collected by each organisation. When the mouse is hovered over one of the bars, a small pop-up shows the exact number.
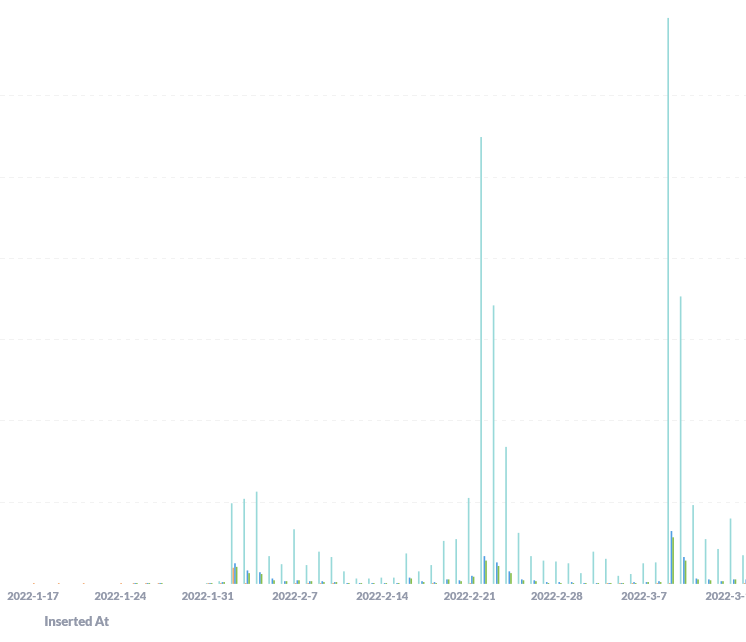
Detailed Analytics
We can also look at various things in more detail, using Metabase. Here are some examples of the most useful data we have.
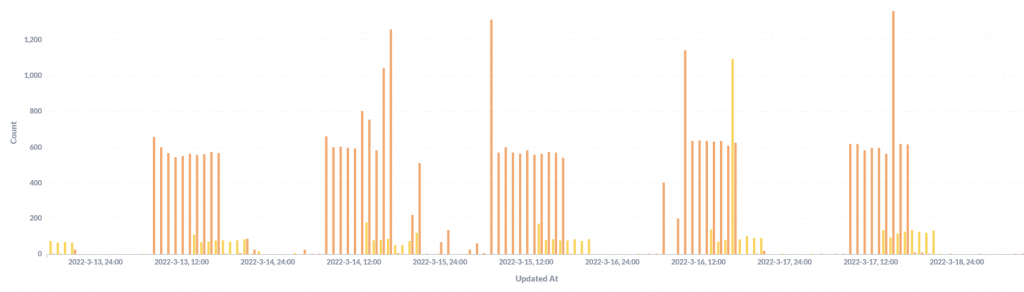
Actions over time:
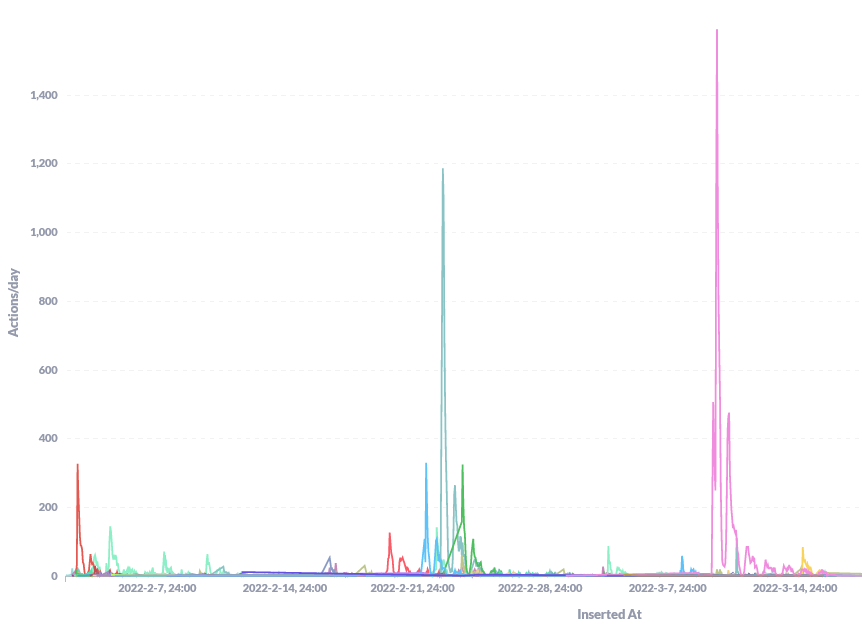
Actions over time, colour coded by partner (this is a different campaign to the previous picture!):
How supporters came to the action:
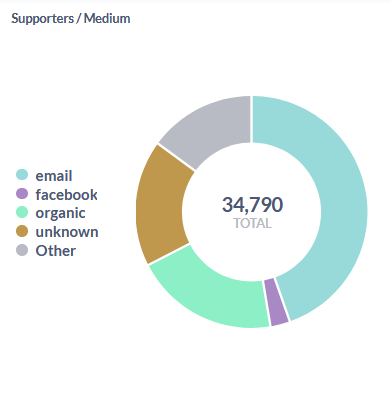
There is a more granular version of this which can show which mail or social media share an action came from too — if tracking parameters are used!
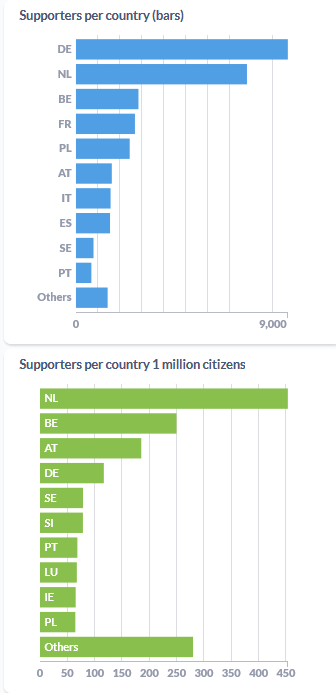
Actions per country:
Emails sent to target (this campaign was set up to send an average amount of emails during office hours):
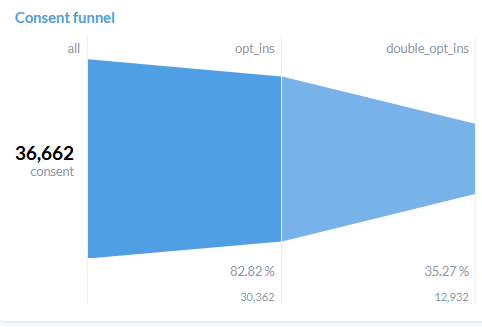
The Consent Funnel that shows how many people opted in to being contacted and how many did a Double Opt-In (although in this campaign, only some partners used this, so the proportion is much lower than typical):
Currently, this sort of analytics is only available as a premium service because we have to manually set it up for each user. But in the future we hope to make this a standard part of our platform — the data is there, we just need to automate it being displayed!